Clickable Maps are a very useful resource in building a responsive website. Some like to call them html image maps. Basically they are images in jpeg, png, tif or jif format and a corresponding html file with co-ordinates of image areas. You can find a lot on them on the web but building a visually appealing map and adding shadow and highlight effect with jQuery is what I will be discussing in this blog today.
Before you read further it will be good to see the map in action, just go over to Clickable jQuery Map of Mexico, Caribbean and Latin America.
There are different ways in which clickable maps can be made. The latest HTML5 can also be used. I use Illustrator CS6 and Avenza MAPublisher Plugin to create my maps. The Avenza MAPublisher plugin is good to import GIS data in ESRI Shapefile format, MapInfo TAB format and many other. It also has built in feature to export any map as HTML5 zoomable map. However it has fixed specifications for the exported map and lacks simple animation which can be added using jQuery which the client insisted. He also wanted that the map should have four clickable links; Mexico, Central America, South America and Caribbean.
Adobe Illustrator in the previous versions of CS3, CS4 could export any map as HTML Map, but from CS6, this facility has been withdrawn. So how to get the co-ordinates of the shapes without CS6? I had already developed the map in Illustrator CS6 with MAPublisher, but now I could not export the map as HTML Map and further I had to join all the countries to generate four regions.
So in a nutshell, there were three requirements for making the clickable HTML Image map:-
- First : Create four regions from the countries
- Two : Find a suitable software program to export as HTML Image Map
- Three : Use jQuery for shadow, hover and clickable effect
The first was the simplest of the three requirements, which I could easily do with Avenza MAPublisher’s geoprocessing function of joining the areas. But here I added another attribute field wherein the countries were suitably categorised into four regions. Then I ran the geoprocessor function of merging the areas by region attribute. This now could be exported as a Shape file to be used in any GIS program.
The second requirement was to find a suitable software program to export as HTML Image Map. And QGIS, an open source GIS work horse came to my rescue here. I highly recommend you to download the latest version of QGIS today itself. A quick Google Search got me a HTML Image Map Creator plugin for QGIS.
So now I used the exported Shapefile from MAPublisher with four regions to create the HTML Image Map. It created a very simple image map as I used a simple fill in the shape file. It also generated the four regions in HTML file.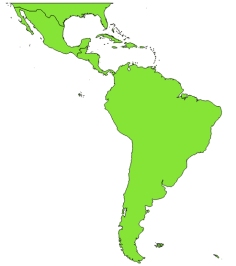
The QGIS created Image is shown on the left and for the HTML file, I used the HREF attribute for the link. Yes, I almost forgot, you can configure the mouseover, mouseclick and click effects in the QGIS HTML Image map plugin. So I had added the four links in the HREF field which I had already created in MAPublisher before exporting the merged countries as Shapefile.
The QGIS Plugin can add simple scripts for simple mouse over and mouse click effects, but I wanted to use jQuery for much complex shadow effect. The task was becoming much complex when I saw the HTML file generated by the QGIS. The screen shot is below…
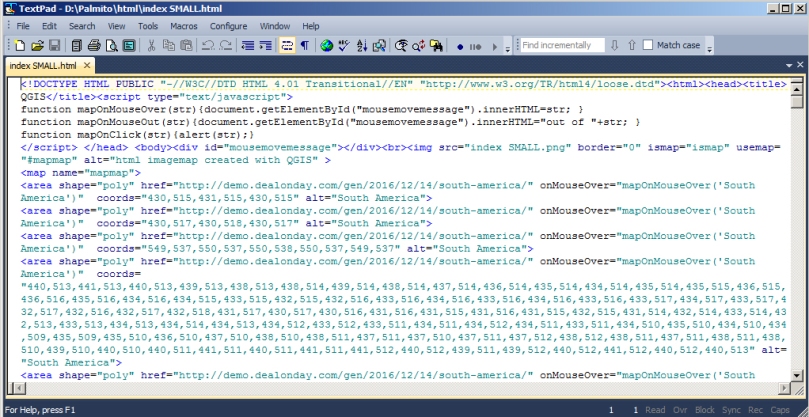
The href attribute is correctly generated but it has further attribute of onMouseOver and what I needed was a title attribute. Another problem with jQuery map that I wanted to make was that jQuery accepted single quotes (‘) whereas this html file had double quotes (“) only. So this is handled very simply by replace function of Texpad. The final html file looked something like this:-

I added the jQuery Script and other details and replaced various parameters for clickable HTML Image map with shadow and highlight.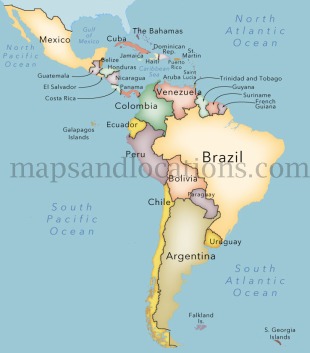
Now came the final major requirement and that was replacing the simple file generated by QGIS with a beautiful looking map prepared with Illustrator and MAPublisher. So for this I measured the map pixels and calculated the DPI (dots per inch) required to export a jpg file from the .ai Illustrator file. Then to adjust it accurately I used Adobe Photoshop and placed the newly created map image accurately on top of the single color map produced with QGIS. You can also use layer opacity function to review if the QGIS generated map and actual full color map matched accurately. Here it is important to note that the co-ordinates generated and placed in the coords attribute have the origin at the left top corner. So even if you truncate the image on the right or bottom, it will not effect the areas. Therefore it is relatively easy to match the image with QGIS generated image.
So with this the Image map with jQuery was completed and you can review it once again here Clickable HTML Image Map with jQuery.
If you need more information on how to make a map like this, you can surely contact me on promapper@gmail.com. And please do give your reviews and comments on the above work flow to make such a clickable map.
Thanks for reading.


