Last week I was toying with American Factfinder. It has phenomenal amount of demographic, economic and housing related data for USA and Puerto Rico. And the reason to fiddle with it was to find data on religious minorities in USA especially those affected by the immigration ban imposed by Mr. Trump. I tried all sorts of search combinations; manual, guided search and even advanced search but could not find demographic data based on religion. Does anyone know how to extract data from American FactFinder on religio-demographic trends in the USA?
Religio-demographic, whether it is an actual word or not but primarily I was looking for the trends in population growth of various religions in the USA. Simply put, how many Christians, Protestants, Roman Catholics, Buddhists, Hindus, Muslims and so on are resident in each state. The data on immigration from various countries or country groups like Asians, Africans et cetera can be easily found but this does not tell you how many of them are Christians, how many Buddhists, or how many Hindus or Muslims or any other faith. So to cut the story short, this kind of data is just not there.
Anyway, during all these searches, there was an interesting dataset on education numbers in the USA, neatly organized for various age groups and also for various education certification levels, like below High School, HS, College Graduate, Professional Degree and Higher education. So a bit of digging around on the site and the education data for all the US States was downloaded as an Excel file. It took a while to understand the data but then in about two hours, I could link up the Excel file with the shape file of USA. The two hours were spent primarily in re-naming the Excel columns suitably so that they are acceptable for the column headers of an ESRI ShapeFile.
State Wise Percentage Population with HS or Lower Qualification. The first thematic map 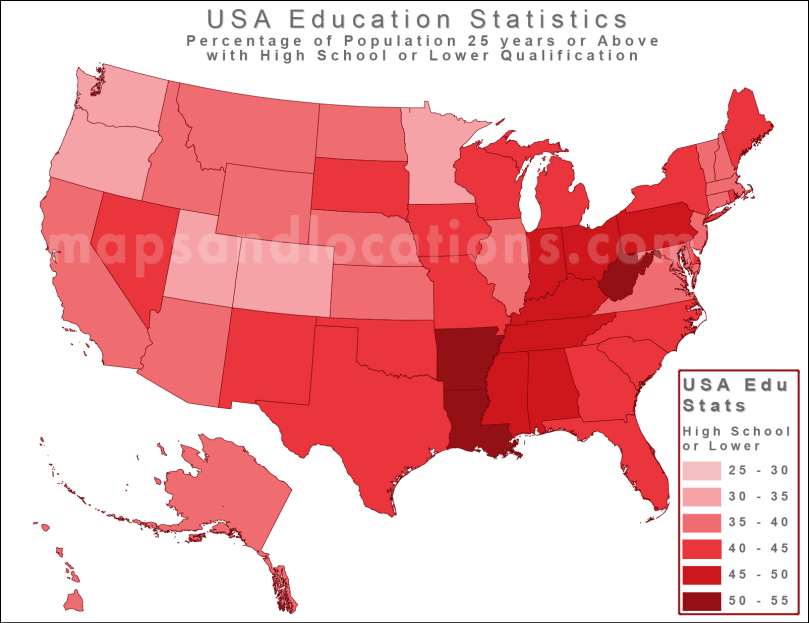 made with the data was the State wise percentage of population aged 25 years or older with a High School or lower qualification. The map you can analyze above wherein the percentage of population of each state aged 25 years or above with a HS or below education has been divided into six categories from 25 percent to 55 percent and you can see Louisiana, Arkansas and West Virginia falling in the category of 50 – 55 percent and West Virginia has the maximum almost 55% population in the 25 years or older with an HS or lower qualification, the other two are around 50.5 percent.
Does this map look familiar and suddenly it dawned on me, yes; similar maps showed the victory of Mr. Trump in the recent US Presidential Elections. The map for Donald Trump’s 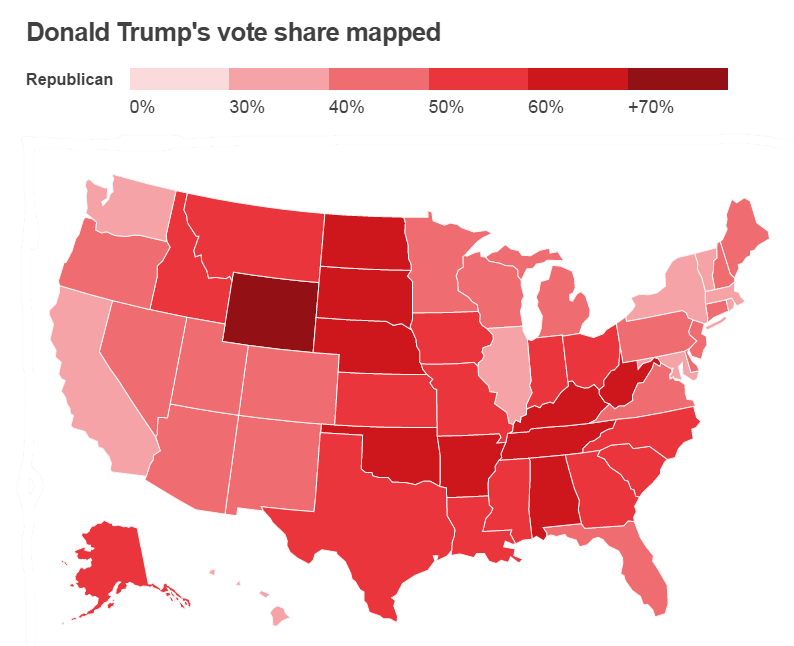
vote share has somewhat similar trend though some aberrations or mis-match do exist. But if you look at the trend, those states with high percentage of HS or below did vote in large numbers for Mr. Trump. The above map is from the BBC analysis of US Elections which you can visit on the link.
Now the opposite of the above which would be Ms. Clinton’s vote share and that should match with highly educated population percentages. So here is the thematic map of percentage 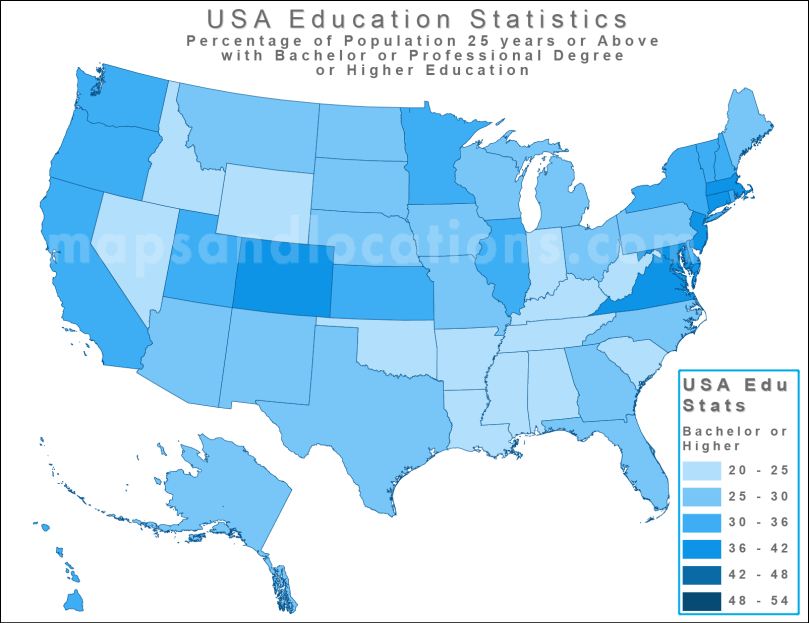 of 25 years or older population with a University/College Degree or Higher qualification. Now here the lower limit begins from 20 percent and goes to 54 percent. So to create six graduations as in the High School or lower education map above, a bit of adjustments were done in the intervals. The Western States like California, Oregon, Washington and North Eastern States like Maryland, New Jersey, New York, Vermont, Massachusetts come in fairly highly educated states with upto 40 percent with a Bachelor / Professional degree or higher education. The top of list with 54 percent highly educated in the 25 years or older population goes to District of Columbia.
Here is the map of Hillary Clinton’s Vote share, again taken from the BBC website. And you 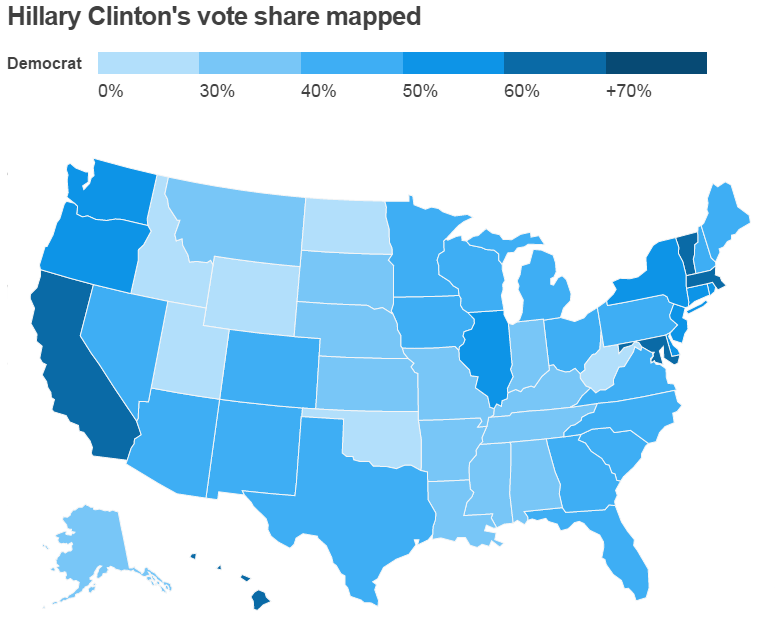 can see the trend similarity in this map too. The highly educated states have generally voted for Hillary with some exceptions like Utah going for Trump with almost similar percentage of highly educated as California. But again the general trend is so very clearly visible in the thematic maps above.
The political rhetoric of Mr. Trump had more meaning and value to the masses of USA with lower education and does this mean that if kids in the USA start to study harder and attain higher education in the coming years, the likes of Mr. Trump would not stand a chance? Or does this mean that even with so much of educational facilities, the USA is still a nation of high school dropouts?
